
Introduction
The TopstepX Dashboard Explained trading platform you use can shape how confidently you make decisions. A cluttered dashboard can make even a simple trade feel stressful. Important information gets buried, charts become hard to read, and a fast-moving futures market does not wait for anyone to find the right button.
That is why many traders spend time learning the TopstepX Dashboard before they start placing serious trades.
TopstepX is designed for futures traders who want a focused workspace for charting, order execution, account monitoring, and performance review. Whether you are completing a Trading Combine, managing a funded account, or simply practicing your process, the dashboard gives you a central place to track the numbers that matter.The platform can look busy at first. There are charts, order panels, account details, risk metrics, market data, and performance tools all competing for attention.Once you understand how the layout works, though, it becomes much easier to build a clean setup that supports your strategy instead of distracting you from it.This guide explains the TopstepX Dashboard in simple terms. We will cover the initial setup, the main tools, risk controls, chart features, order entry options, and practical trading tips that can help you use the platform more effectively.
What Is the TopstepX Dashboard?
The TopstepX Dashboard is the main trading workspace used by traders on the Topstep platform. It combines several tools that traders often need during a futures trading session.nstead of jumping between multiple windows, you can view market charts, place orders, monitor positions, review account balances, and track performance from one interface.For many traders, this matters because futures markets move quickly.
A trader may need to watch price action on the E-mini S&P 500, check their open position, adjust a stop loss, and confirm remaining buying power within seconds. A well-organized dashboard helps make those actions smoother.
The platform is built around a few core areas:
- Charts and technical analysis
- Order entry and trade management
- Account balance and risk monitoring
- Position tracking
- Performance statistics
- Market watchlists
- Trading session controls
The goal is not to give you every possible tool in the world. It is to give you the tools needed to execute a trading plan without creating unnecessary clutter.
Getting Started: How to Set Up TopstepX Dashboard
Your first TopstepX setup should be simple.
Many new traders make the mistake of adding too many charts, indicators, watchlists, and widgets on day one. That usually creates confusion instead of clarity.Start with the instruments you actually trade.If you mainly trade index futures, you may focus on contracts such as the E-mini S&P 500, Nasdaq-100, Dow futures, or Russell 2000 futures. If you trade commodities, you may add crude oil, gold, natural gas, or other relevant contracts.The best dashboard is not the most complicated one. It is the one that lets you see your trading opportunities quickly.
Step 1:Choose Your Market on the TopstepX Dashboard
Open the market search or watchlist section and select the futures contracts you plan to monitor.Avoid tracking ten markets if you only trade one or two. A smaller watchlist makes it easier to stay focused.
For example, a day trader who trades Nasdaq futures may only need:
- NQ or MNQ contract
- ES or MES contract for market comparison
- VIX-related market data, if relevant
- A major economic calendar outside the platform
This setup keeps the dashboard clean while still giving enough context for decision-making.
Step 2: Build Your Chart Layout
Charts are usually the center of a trader’s workspace.The TopstepX Dashboard allows traders to customize chart views based on their strategy. You may prefer a single large chart, two timeframes side by side, or a multi-chart layout.
A simple layout for intraday futures trading could include:
- One 5-minute chart for trade setups
- One 15-minute chart for market structure
- One 1-minute chart for execution timing
- One higher-timeframe chart for key support and resistance zones
You do not need every timeframe. Use only the charts that help you make better decisions.If you trade based on breakouts, volume, moving averages, or support and resistance, build your layout around that method.
Step 3: Add Only Useful Indicators
Indicators should support your analysis, not replace it.Many traders overload charts with moving averages, oscillators, volume tools, pivot levels, and custom signals. The result is often a chart that looks impressive but is hard to read under pressure.
A cleaner setup may include:
- Volume bars
- VWAP
- One or two moving averages
- Previous day high and low
- Opening range levels
- Support and resistance zones
If an indicator does not help you enter, manage, or exit trades, consider removing it.The TopstepX Dashboard works best when your chart setup reflects a clear trading process.
Understanding the Main TopstepX Dashboard Tools
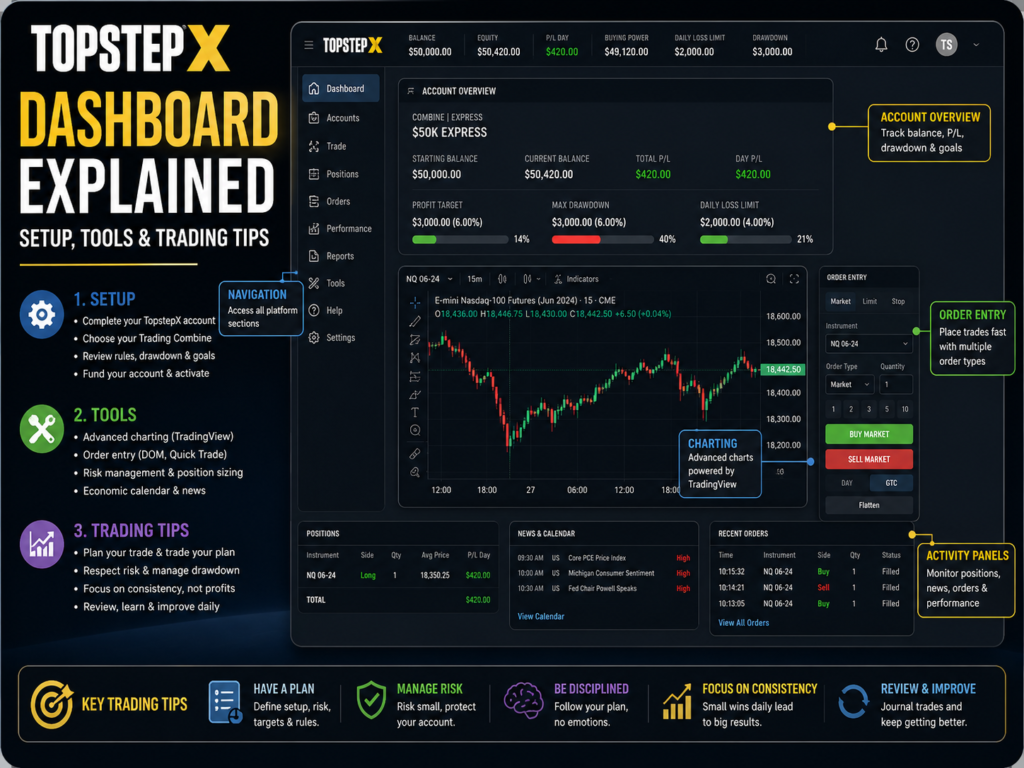
The TopstepX Dashboard brings the most important futures trading tools into one workspace, making it easier to analyze price action, place trades, and manage risk without switching between multiple platforms. At first, the screen may look crowded because it includes charts, order buttons, account metrics, watchlists, and open-position details. Once you understand the purpose of each section, the dashboard becomes much easier to use.The charting area helps traders study market movement through candlestick charts, different timeframes, volume data, technical indicators, and drawing tools. You can mark support and resistance zones, trendlines, previous highs and lows, and important intraday levels before placing a trade.The order entry panel is where you select the futures contract, choose buy or sell, set your quantity, and place market, limit, or stop orders. It also helps traders attach stop-loss and profit-target levels so risk is planned before entering a position.The account and position section shows real-time information such as current profit and loss, open trades, buying power, drawdown, and daily risk limits. This helps you avoid overtrading or taking large positions when your account is close to its loss limit.
Together, these tools create a more organized trading environment. Instead of reacting emotionally to fast market moves, traders can use the dashboard to follow a structured plan, control risk, and make clearer decisions..
TopstepX Dashboard Charting Tools
Charting is where most traders spend the majority of their time.You can use charts to identify trends, key price levels, momentum shifts, consolidations, and possible entry points. Depending on your strategy, you may use candlestick charts, line charts, bar charts, or other formats.
Useful charting features often include:
- Multiple timeframes
- Drawing tools
- Trendlines
- Horizontal support and resistance levels
- Volume analysis
- Technical indicators
- Zoom and replay options
A good habit is to mark important levels before the market opens.
These may include the prior day’s high and low, overnight high and low, major round numbers, opening range boundaries, and areas where price previously reacted strongly.This reduces the need to make rushed decisions during live market movement.
Order Entry Panel on TopstepX Dashboard
The order entry panel is one of the most important parts of the TopstepX Dashboard.This is where you choose your contract, position size, order type, and risk controls.Common order types include market orders, limit orders, stop orders, and stop-limit orders. Each has a different purpose.A market order enters or exits at the best available price. It is fast, but the exact fill price can vary in volatile conditions.A limit order lets you set the maximum price you will pay when buying or the minimum price you will accept when selling. It gives more price control, but there is no guarantee the order will fill.A stop order is often used to protect a position or enter a breakout. For example, a trader may place a stop-loss order below a support level to limit downside risk.
Before placing an order, double-check three things:
- Contract size
- Buy or sell direction
- Stop-loss location
A surprising number of trading mistakes happen because a trader clicks the wrong quantity or enters an order on the wrong contract.
Position and Account Monitoring on TopstepX Dashboard
The account section gives you a live view of your trading status.Depending on the account type and platform settings, you may see information such as account balance, unrealized profit and loss, realized profit and loss, buying power, drawdown, and daily risk limits.This is where discipline becomes practical.A trader may have a great chart setup, but if they are close to their daily loss limit, taking another aggressive trade may not be a smart decision.
The TopstepX Dashboard helps keep these numbers visible so risk is not treated as an afterthought.Many experienced traders keep the account panel visible at all times. They do not stare at it after every tick, but they know exactly where they stand before taking a new trade.
Trade Management Tools
Trade management is often more important than trade entry.A good entry can still become a losing trade if the position is managed poorly. The dashboard gives traders tools to adjust stops, take partial profits, close positions, and monitor open orders.
For example, you may enter a trade with:
- A predefined stop-loss
- A first profit target
- A second profit target
- A trailing stop plan
- A maximum time limit for the trade
Planning these details before entry can reduce emotional decisions.Instead of asking, “What should I do now?” after every small price movement, you already have rules in place.
How to Use TopstepX for Better Risk Management
Risk management is not a separate part of trading. It is part of every order you place.The TopstepX Dashboard gives you the information needed to monitor risk in real time, but you still need personal rules.
A practical risk plan may include:
- Maximum loss per trade
- Maximum daily loss
- Maximum number of trades per day
- Maximum contract size
- A rule for stopping after consecutive losses
- A rule for protecting profits after a strong morning
For example, if your plan allows a $150 loss per trade, your stop-loss should be placed based on that amount before entering the position.Do not move the stop farther away simply because the trade is losing.That turns a planned loss into an emotional decision.Another useful rule is to reduce size after a losing streak. If you normally trade three contracts, consider trading one contract after two or three losses. This gives you room to reset without increasing damage.The dashboard can show you the numbers, but your rules decide what you do with them.
Performance Tracking: Learn From Every Trading Session
One of the strongest parts of using a platform like TopstepX is the ability to review your performance.Many traders only remember their biggest winners and biggest losers. That is not enough to improve.Performance data can reveal habits you may not notice during live trading.
You may discover that:
- Your best trades happen during the first two hours of the session.
- You lose money when trading after a major news release.
- Your average losing trade is larger than your average winning trade.
- You overtrade after one loss.
- You perform better with one setup than with several different strategies.
These insights are valuable because they turn trading improvement into something measurable.
After each session, review your trades and ask:
- Did I follow my entry rules?
- Did I respect my stop-loss?
- Did I trade during my best time window?
- Did I take trades outside my plan?
- Did I increase size emotionally?
- What setup worked best today?
You do not need a long journal entry every day. Even a few notes can reveal patterns over time.
Practical TopstepX Trading Tips
The TopstepX Dashboard can give you charts, order-entry tools, account data, and performance insights, but it cannot make trading decisions for you. Your results depend on how consistently you follow a clear process. The best way to use the platform is to build a routine that reduces rushed decisions and keeps risk under control.Start each session with a short pre-market plan. Mark important support and resistance levels, check for major economic news, choose the futures contracts you will trade, and decide your maximum daily loss before the market becomes active. This gives you a structure to follow when prices begin moving quickly.Keep your dashboard layout simple and consistent. Use only the charts, indicators, and widgets that support your strategy. Too many indicators can create confusion, while a clean layout helps you spot trade setups faster.Before entering any trade, confirm your contract size, entry direction, stop-loss level, and profit target. A stop-loss should be placed where your trade idea becomes invalid, not where you simply hope price will reverse.Avoid increasing position size after a losing trade. If you experience several losses, reduce your size or stop for the day. Use the account panel to monitor daily drawdown and open risk.
Finally, review your trades after each session. Identify whether you followed your rules, what setups worked best, and where emotions affected your decisions. Small, consistent improvements often produce better results than constantly changing strategies.
Keep Your Layout Consistent
A consistent TopstepX Dashboard layout helps you trade with more focus and less confusion. When your charts, order-entry panel, open positions, and account details stay in the same place every day, you can find important information quickly during fast market movement. This reduces unnecessary stress and helps prevent simple mistakes, such as entering the wrong contract or missing an open order.Set up your dashboard around your trading routine. Keep your main chart visible, place the order panel nearby, and make sure your profit-and-loss and risk information are easy to check. Small adjustments are fine when they improve your workflow, but avoid rebuilding the entire layout after one losing trade. A bad trade does not always mean your dashboard is the problem. Consistency helps you review performance fairly and follow your trading plan with greater discipline.
Use a Pre-Market Checklist
Before the market opens, check your key levels, economic events, contract selection, account status, and trading plan.A short checklist can prevent avoidable mistakes.
For example:
- Is there major economic news today?
- What are the overnight high and low?
- What is my maximum daily loss?
- Which setups am I allowed to trade?
- What time will I stop trading?
Avoid Watching Every Tick
Watching every small price movement can create stress and make you react too quickly. In fast futures markets, a few seconds of movement may look important, but it often has no effect on your actual trade setup. Constantly checking a 10-second or 1-minute chart can lead to early exits, unnecessary entries, and overtrading.Use the timeframe that matches your strategy. If your setup is based on a 5-minute chart, focus on completed 5-minute candles, key levels, and your planned entry conditions. Avoid changing your decision because of minor movement on a lower timeframe. Trust your trading plan, keep your stop-loss in place, and only act when price gives a valid signal according to your rules.
Set Stops Before Emotion Takes Over
A stop-loss should be decided before you enter a trade, not after the market starts moving against you. When traders wait too long to set a stop, emotions can take control. They may keep hoping that price will reverse, move the stop farther away, or hold a losing position longer than planned. This can turn a small, manageable loss into a much larger one.
Before placing an order, identify the price level where your trade idea is no longer valid. For example, if you buy because price is holding above support, your stop-loss may belong below that support level. If price breaks below it, the reason for entering the trade has changed.Your stop placement should also match your allowed dollar risk. Calculate the distance between your entry and stop, then choose a contract size that keeps the possible loss within your daily plan. A clear stop-loss protects your account, reduces emotional decisions, and helps you trade with greater consistency.
Review, Adjust, Repeat
Trading improvement usually comes from small adjustments. Maybe you need fewer trades. I think you perform best during one market session. One indicator adds no value. Use your TopstepX performance data to make those decisions based on evidence, not frustration.
| Area to Review | What It Means | What to Check in TopstepX | Possible Adjustment |
|---|
| Number of Trades | Too many trades can lead to overtrading and lower-quality entries. | Review how many trades you take each day and identify whether extra trades follow losses or boredom. | Set a daily trade limit and focus only on your strongest setups. |
| Stop-Loss Size | A stop that is too wide can create larger losses, while one that is too tight may close good trades early. | Compare your average loss with your planned risk amount and review where stops were triggered. | Adjust stop placement based on market structure and reduce contract size if needed. |
| Best Trading Session | Many traders perform better during a specific market period, such as the opening hour or late morning. | Check which time of day produces your best win rate, profit, and most disciplined trades. | Trade mainly during your strongest session and avoid lower-performing hours. |
| Indicator Performance | Some indicators may help your decisions, while others can add confusion or delay entries. | Review whether an indicator actually improves your entries, exits, or trade confidence. | Remove indicators that do not support your strategy and keep charts simple. |
| Trade Setup Quality | Not every setup produces the same results. Your strongest setup may be responsible for most of your profits. | Group trades by setup type and compare win rate, average profit, and average loss. | Focus more on high-performing setups and avoid low-quality trade patterns. |
Final Thoughts
The TopstepX Dashboard is more than a place to place buy and sell orders. It is a workspace for planning, execution, risk management, and performance review.A clean setup helps you stay focused. Clear risk controls help protect your account. Performance tracking helps you understand what is actually working.Start simple. Trade the markets you understand. Keep your charts clean. Use predefined risk rules. Then review your results consistently.The best TopstepX Dashboard setup is not the one with the most tools. It is the one that helps you follow your trading plan when the market gets fast, noisy, and unpredictable.